Becoming a data analyst is an attractive career direction for graduates, working professionals and individuals looking to transition into the technology industry. Businesses across industries generate large amounts of data, but they need professionals who can organise, analyse and interpret that information to support better decisions.
In Malaysia, data analytics skills are relevant across industries such as banking, finance, retail, telecommunications, manufacturing, healthcare and logistics. Professionals with the ability to work with spreadsheets, SQL, Python and business intelligence tools can support organisations in understanding business performance and identifying opportunities for improvement.
However, becoming a data analyst involves more than learning software or creating dashboards. You need to understand business requirements, work with different data sources, identify patterns, interpret results and communicate findings to stakeholders.
Whether you are a fresh graduate, an Excel user or an experienced professional exploring a career change, this guide explains how to become a data analyst in Malaysia, including the essential skills, tools, certifications, learning roadmap and career opportunities.
What Does a Data Analyst Do?
A data analyst collects, cleans, processes and analyses information to help businesses make informed decisions.
Organisations use data from multiple sources, including customer transactions, website activity, sales records, financial systems, operational reports and customer feedback.
A data analyst examines this information to identify patterns, measure performance and provide insights that help organisations solve business problems.
For example, consider a retail company operating multiple stores across Malaysia. Management wants to understand why sales have decreased in certain locations.
A data analyst may:
- Collect sales information from different stores.
- Use SQL to retrieve and combine transaction records.
- Clean incomplete or inconsistent data.
- Analyse sales performance by product, location and time period.
- Create a Power BI dashboard to display important performance indicators.
- Identify factors contributing to declining sales.
- Present findings and recommendations to management.
The objective is not simply to produce reports. It is to transform raw information into useful business insights.
Key Responsibilities of a Data Analyst
Although responsibilities vary between organisations, common tasks include:
- Data collection — Gather information from databases, spreadsheets, business applications, APIs and other available sources.
- Data cleaning — Identify missing values, remove duplicate records, correct inconsistencies and prepare information for analysis.
- Data analysis — Use statistical techniques, SQL queries and analytical tools to identify trends, relationships and performance patterns.
- Data visualisation — Create dashboards, charts and reports that help stakeholders understand important business metrics.
- Reporting and communication — Explain findings, present recommendations and communicate analytical results to technical and non-technical stakeholders.
- Business performance monitoring — Track KPIs, compare performance across periods and identify opportunities for operational improvement.
What Skills Do You Need to Become a Data Analyst in Malaysia?
A successful data analyst needs a combination of technical, analytical and communication skills. You do not need to master every programming language before starting, but you should develop a strong foundation in working with data.
Here are the essential skills to focus on.
1. Microsoft Excel and Spreadsheet Skills
Excel is one of the most useful starting points for individuals learning data analytics.
Many organisations use spreadsheets for financial reporting, sales tracking, operational analysis and business planning.
Before moving into advanced analytical tools, develop the ability to work with datasets and perform basic analysis using Excel. Explore Excel training at Nexperts Academy.
Important Excel skills include:
- Sorting and filtering datasets.
- Using formulas and functions.
- VLOOKUP, XLOOKUP and INDEX-MATCH.
- Pivot tables and pivot charts.
- Conditional formatting.
- Data validation.
- Removing duplicates and handling missing information.
- Creating basic reports and dashboards.
For example, a sales analyst may use Excel to calculate monthly revenue, compare product performance and identify changes in regional sales.
2. SQL for Data Analysis
SQL (Structured Query Language) is an essential skill for working with relational databases.
Businesses store information in databases containing customer details, orders, transactions, product records and operational information.
Data analysts use SQL to retrieve, combine, filter and summarise this information.
Important SQL concepts include:
- SELECT and FROM statements.
- WHERE conditions.
- ORDER BY and GROUP BY.
- Aggregate functions such as SUM, COUNT and AVG.
- INNER JOIN, LEFT JOIN and other joins.
- Subqueries and Common Table Expressions.
- Window functions.
- Data filtering and aggregation.
For example, an analyst working for an ecommerce business may use SQL to identify the top-performing products, calculate monthly revenue and compare repeat customers with first-time buyers.
Recommended learning: SQL for Data Analytics at Nexperts Academy.
3. Python for Data Analytics
Python is a widely used programming language for data analysis, automation and data science.
It helps analysts work with larger datasets, automate repetitive tasks and perform more advanced analysis.
You do not need to become a software developer to start learning Python for data analytics. Begin with basic programming concepts and gradually develop your analytical capabilities.
Important Python topics include:
- Variables and data types.
- Lists, dictionaries and loops.
- Functions and conditional statements.
- Reading CSV and Excel files.
- Working with Pandas and NumPy.
- Data cleaning and transformation.
- Exploratory data analysis.
- Data visualisation using Matplotlib and Seaborn.
For example, a data analyst may use Python to combine several monthly sales files, remove duplicate transactions, calculate revenue and generate charts for further analysis.
Recommended learning: Python for Data Analytics Training in Malaysia.

4. Power BI and Data Visualisation
Data analysis is not complete when you discover a pattern. You also need to communicate that information clearly.
Power BI is a business intelligence platform used to transform data into interactive reports and dashboards.
It helps analysts connect to data sources, prepare datasets, build data models, create calculations and share insights with business stakeholders.
Important Power BI skills include:
- Connecting to Excel, SQL and other data sources.
- Data cleaning using Power Query.
- Creating relationships between tables.
- Data modelling.
- Writing DAX measures.
- Developing interactive dashboards.
- Using filters and slicers.
- Publishing and managing reports.
- Implementing row-level security.
Microsoft's PL-300 certification focuses on preparing data, modelling data, visualising and analysing data, and managing and securing Power BI. It also expects proficiency in Power Query and DAX.
Recommended learning: Microsoft Power BI PL-300 Certification Training in Malaysia.
5. Tableau for Data Analytics
Tableau is another widely used business intelligence and data visualisation platform.
It enables analysts to explore datasets, create interactive visualisations and communicate business insights through dashboards.
Important Tableau skills include:
- Connecting to Excel, CSV and database sources.
- Understanding dimensions and measures.
- Creating charts and visualisations.
- Working with filters and parameters.
- Creating calculated fields.
- Building interactive dashboards.
- Using joins and data relationships.
- Publishing and sharing dashboards.
Power BI and Tableau serve similar business intelligence purposes, but organisations may prefer one platform based on their existing technology environment.
Recommended learning options:
- <a href="/courses/tableau-desktop-specialist">Tableau Desktop Specialist Training</a>
- <a href="/courses/advanced-data-visualization-tableau">Data Analytics and Visualisation with Tableau</a>
6. Statistics and Analytical Thinking
Technical tools help you process information, but statistical knowledge helps you interpret it correctly.
Data analysts should understand how to interpret numerical information, identify patterns and distinguish meaningful changes from random variation.
Important statistical concepts include:
- Mean, median and mode.
- Percentages and percentage changes.
- Variance and standard deviation.
- Probability.
- Correlation.
- Distribution.
- Sampling.
- Hypothesis testing.
- Descriptive statistics.
Understanding statistics helps analysts avoid presenting misleading conclusions — for example, investigating whether a 15% sales increase came from demand, promotions, seasonality or pricing.
7. Communication and Data Storytelling
A data analyst must explain findings in a way that stakeholders can understand and act upon.
Develop the ability to:
- Understand business questions.
- Explain analytical findings clearly.
- Present important KPIs.
- Highlight trends and anomalies.
- Support recommendations with evidence.
- Communicate with technical and non-technical teams.
A useful analytical report should explain what happened, why it may have happened, what impact it has and what action the organisation should consider.
Which Tools Should You Learn First as a Beginner?
There are several tools available for data analytics, but beginners should avoid trying to learn everything simultaneously.
Start with the tools that help you complete a practical end-to-end analytical task.
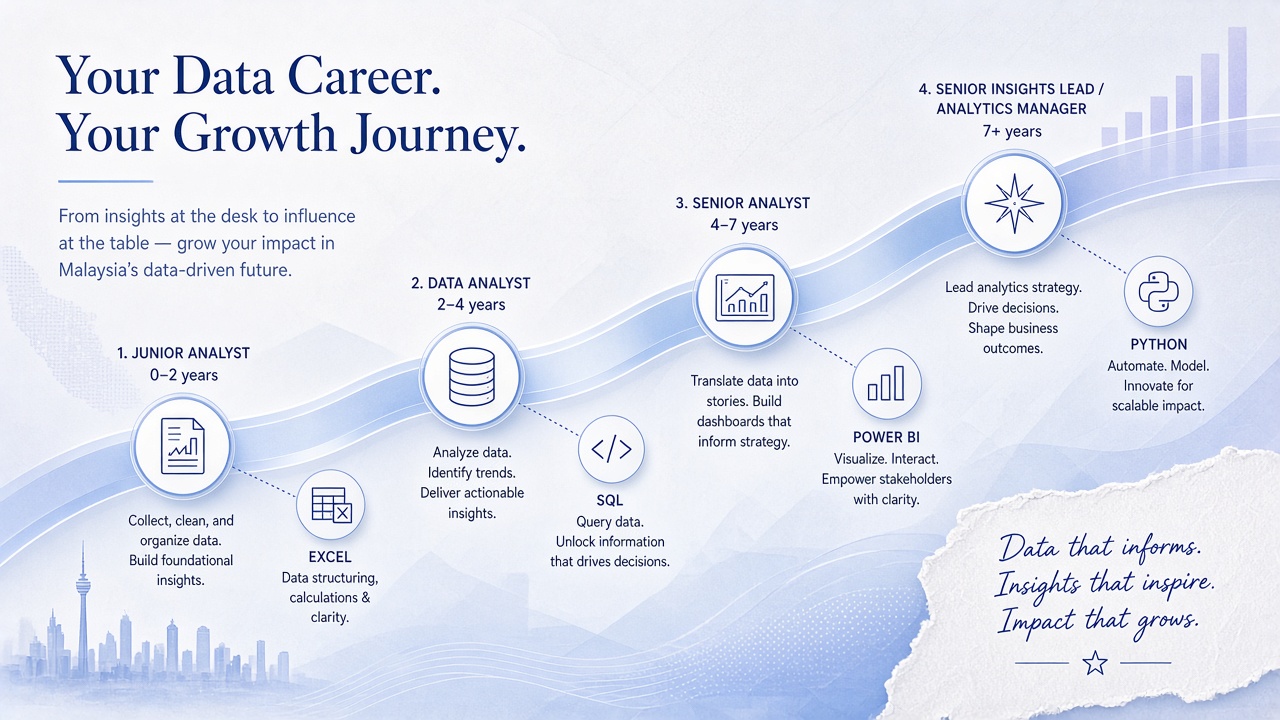
A practical starting sequence is:
Excel → SQL → Power BI → Python → Advanced Analytics
| Tool | Primary purpose | Learning priority |
|---|---|---|
| Microsoft Excel | Data organisation and basic analysis | High |
| SQL | Database querying and data retrieval | High |
| Power BI | Dashboards and business reporting | High |
| Python | Data processing and automation | Medium |
| Tableau | Data visualisation and dashboards | Medium |
| Statistics | Interpreting analytical results | High |
Tableau can be learned alongside or after Power BI, depending on the tools used by your target employers. You do not need to master both Power BI and Tableau before applying for entry-level roles.
Step-by-Step Roadmap: How to Become a Data Analyst in Malaysia
If you are starting without previous data analytics experience, follow a structured learning roadmap rather than jumping between different courses.
Step 1: Understand Data Analytics Fundamentals
Start by understanding what data analytics means and how organisations use information to make decisions.
Learn about / practise:
- Types of data.
- Structured and unstructured data.
- Data sources.
- Data collection.
- Data cleaning.
- Data transformation.
- Exploratory data analysis.
- Key performance indicators.
Step 2: Develop Excel Skills
Learn spreadsheet fundamentals and practise working with small datasets such as sales records, employee information, customer transactions or operational data. Practise calculating totals, percentages, averages and performance comparisons.
Step 3: Learn SQL
Once you are comfortable working with spreadsheets, learn SQL to retrieve and analyse information from relational databases. Practise writing queries, combining tables and calculating business metrics.
Step 4: Learn a Business Intelligence Tool
Choose Power BI or Tableau as your primary visualisation platform. Start with connecting to datasets, cleaning data and creating basic charts, then develop data modelling, DAX calculations, interactive filters and dashboard design.
Step 5: Develop Python Skills
After developing basic database and reporting skills, introduce Python. Start with Pandas for data manipulation and NumPy for numerical operations.
Learn about / practise:
- Loading datasets.
- Handling missing values.
- Removing duplicates.
- Combining multiple files.
- Calculating metrics.
- Exploring trends.
- Creating visualisations.
Step 6: Understand Statistics and Business Analysis
Develop your ability to investigate business questions and interpret analytical results. Learn how to identify changes, compare performance, interpret relationships and explain business implications.
Step 7: Build a Data Analytics Portfolio
Create projects using publicly available datasets or appropriately anonymised sample data. Your portfolio should demonstrate the entire analytical process, including the business problem, data preparation, analysis, visualisation and recommendations.
Step 8: Prepare for Data Analyst Job Applications
Highlight SQL and database skills, Excel analysis, Power BI or Tableau dashboards, Python data processing, statistical knowledge, practical portfolio projects, and communication abilities. Tailor your resume to each job advertisement.
Data Analytics Portfolio Projects You Should Build
Practical projects help demonstrate that you can use analytical tools to solve business problems.
1. Sales Performance Analysis Dashboard
Business problem: A retail business wants to understand its sales performance across different stores and product categories.
Tools: Excel, SQL and Power BI.
Tasks:
- Analyse sales transactions.
- Calculate total revenue.
- Identify top-performing products.
- Compare monthly performance.
- Analyse regional sales.
- Create an interactive dashboard.
Expected output: A sales performance dashboard with revenue trends, product performance and regional comparisons.
2. Customer Segmentation Analysis
Business problem: An ecommerce company wants to understand customer purchasing behaviour.
Tools: Python, Pandas and Power BI.
Tasks:
- Clean customer transaction records.
- Identify repeat customers.
- Calculate purchasing frequency.
- Analyse average order value.
- Segment customers based on purchasing behaviour.
- Visualise customer groups.
Expected output: A customer analysis report showing purchasing patterns and customer segments.
3. Financial Performance Analysis
Business problem: A finance department wants to monitor monthly expenses and budget performance.
Tools: Excel, SQL and Power BI.
Tasks:
- Organise financial transaction data.
- Compare actual spending with budget.
- Calculate monthly variances.
- Identify categories with higher expenses.
- Build financial reporting dashboards.
Expected output: A financial performance dashboard with expense trends, budget comparisons and variance analysis.
4. Website Traffic Analysis
Business problem: A marketing team wants to understand website performance and identify opportunities to improve conversions.
Tools: Python, SQL and Power BI.
Tasks:
- Analyse website sessions.
- Compare traffic sources.
- Examine landing-page performance.
- Monitor conversion rates.
- Identify traffic trends.
- Present recommendations.
Expected output: A marketing analytics dashboard with traffic, engagement and conversion metrics.
5. Operational Performance Analysis
Business problem: A logistics company wants to understand delivery performance and identify delays.
Tools: SQL, Excel and Tableau.
Tasks:
- Analyse delivery records.
- Calculate average delivery time.
- Compare regional performance.
- Identify delayed deliveries.
- Examine operational trends.
- Build a performance dashboard.
Expected output: An operational dashboard showing delivery performance, delays and regional comparisons.
For every portfolio project, document the business problem, dataset, tools used, analytical approach, key findings and recommendations. Avoid uploading confidential employer or customer information.
What Certifications Should You Consider for a Data Analyst Career?
Certifications can help you develop structured knowledge and demonstrate proficiency in specific tools. However, a certification alone does not guarantee employment. Employers may also assess practical skills, project experience, communication and problem-solving ability.
1. Microsoft Power BI Data Analyst Associate (PL-300)
The Microsoft PL-300 certification focuses on data preparation, modelling, visualisation, analysis and Power BI administration. Key areas include Power Query, data modelling, DAX, dashboards and data security.
2. Tableau Desktop Specialist
The Tableau Desktop Specialist credential is an entry-level certification focused on fundamental Tableau knowledge — connecting to datasets, exploring information, creating visualisations and building dashboards.
3. Practical Data Analytics Training
Apart from vendor certifications, practical training can help learners build the technical skills needed to perform data analysis. Consider learning SQL, Python, Excel and business intelligence tools through guided exercises and portfolio projects.
Data Analyst Career Opportunities in Malaysia
Data analytics skills can be applied across several industries in Malaysia. Organisations use data to monitor operations, understand customer behaviour, improve financial performance and support business planning.
| Industry | Example data analyst responsibilities |
|---|---|
| Banking and finance | Financial reporting, transaction analysis and customer segmentation |
| Retail and ecommerce | Sales analysis, product performance and customer behaviour |
| Telecommunications | Customer analytics, usage trends and churn analysis |
| Manufacturing | Production reporting, quality analysis and operational performance |
| Healthcare | Service utilisation, operational reporting and resource analysis |
| Logistics | Delivery performance, shipment analysis and operational efficiency |
| Marketing | Campaign reporting, customer acquisition and conversion analysis |
Common Data Analyst Job Titles
Depending on your experience and technical skills, you may encounter job titles such as:
- Junior Data Analyst
- Data Analyst
- Business Intelligence Analyst
- Reporting Analyst
- Business Analyst
- Sales Analyst
- Marketing Analyst
- Financial Analyst
- Operations Analyst
These roles can have different requirements even when their job titles appear similar. Read the job description carefully before selecting your learning pathway.
How Long Does It Take to Become a Data Analyst?
The time required to develop data analytics skills depends on your starting knowledge, learning schedule and practical experience.
Here is an illustrative six-month learning roadmap. This is a suggested learning sequence, not a guaranteed job-readiness timeline. Consistency and practical application are more important than simply completing courses quickly.
| Month | Learning focus | Practical outcome |
|---|---|---|
| Month 1 | Excel and analytics fundamentals | Spreadsheet analysis |
| Month 2 | SQL and database querying | SQL analysis project |
| Month 3 | Power BI and dashboard development | Interactive dashboard |
| Month 4 | Python and data processing | Data cleaning project |
| Month 5 | Statistics and advanced analysis | Analytical report |
| Month 6 | Portfolio and interview preparation | Completed portfolio |
Data Analyst Training Courses in Malaysia at Nexperts Academy
For individuals looking to develop data analytics skills, Nexperts Academy offers training programmes covering different areas of the analytical workflow.
1. SQL for Data Analytics
SQL training helps learners retrieve, combine, clean and summarise data from relational databases. The course includes practical business scenarios involving sales performance, customer activity and operational reporting.
Suitable for: Beginners and professionals who want to develop database querying and data analysis skills.
Explore SQL for Data Analytics Training →
2. Python for Data Analytics
Python training introduces learners to programming techniques used in data processing, analysis and automation. Practical exercises help participants apply Python to workplace-related analytical tasks.
Suitable for: Excel or SQL users, aspiring data analysts and professionals looking to expand their analytical capabilities.
Explore Python for Data Analytics Training →
3. Microsoft Power BI PL-300 Certification Training
This programme focuses on Power BI, Power Query, DAX, data modelling, dashboard development and reporting. It is relevant for learners preparing for the Microsoft Power BI Data Analyst Associate certification.
Suitable for: Aspiring data analysts, business intelligence professionals, finance executives and reporting specialists.
Explore Power BI PL-300 Training in Malaysia →
4. Tableau Desktop Specialist Training
This training covers Tableau fundamentals, data connections, visualisation, dashboard development and sharing insights. It is relevant for professionals preparing for the Tableau Desktop Specialist credential.
Suitable for: Beginners, business analysts, marketing analysts and reporting professionals.
Explore Tableau Desktop Specialist Training →
5. Data Analytics and Visualisation with Tableau
This practical programme focuses on connecting datasets, preparing information, creating charts and developing interactive Tableau dashboards. It develops applied visual analytics skills rather than preparation for an external certification examination.
Suitable for: Aspiring data analysts, business analysts, finance professionals and operations teams.
Explore Data Analytics and Visualisation with Tableau →
6. Data Science Foundation
The Data Science Foundation programme introduces the broader data science lifecycle, including problem framing, data wrangling, exploratory data analysis, basic modelling and communicating findings.
Suitable for: Analysts, students, developers and professionals exploring data science.
Explore Data Science Foundation Training →
Frequently Asked Questions About Becoming a Data Analyst in Malaysia
How can I become a data analyst in Malaysia?
Start by learning Excel, SQL, statistics and a business intelligence tool such as Power BI or Tableau. Develop Python skills as you progress, build practical portfolio projects and prepare for relevant job opportunities.
Is data analytics a good career choice in Malaysia?
Data analytics is relevant across industries such as finance, retail, telecommunications, manufacturing, healthcare and logistics. Career prospects depend on skills, experience and employer requirements.
What qualifications do I need to become a data analyst?
Requirements vary by employer. Some positions require a degree in computer science, information technology, statistics, mathematics, business analytics or a related discipline. Other employers may consider relevant technical skills, certifications, practical projects and professional experience.
Can I become a data analyst without coding experience?
Yes. You can begin with Excel, SQL fundamentals and Power BI before moving into Python. However, learning programming can expand the types of analytical tasks you can perform.
Is SQL necessary for data analysts?
SQL is an important skill because it allows analysts to retrieve, combine and summarise information stored in relational databases. Many business analytics workflows involve working with database information.
Should I learn Python or Power BI first?
If your main objective is business reporting and dashboard development, Power BI is a practical starting point after learning spreadsheet and SQL fundamentals. Python is useful for more advanced data manipulation, automation and statistical analysis.
Which certification is best for data analysts?
The Microsoft Power BI Data Analyst Associate (PL-300) and Tableau Desktop Specialist credentials are relevant options. The best choice depends on your target role and the technologies used by employers.
How long does it take to learn data analytics?
The learning period varies according to your previous knowledge, study time and practical experience. A structured six-month learning plan can provide a foundation, but becoming job-ready requires consistent practice and portfolio development.
What is the difference between a data analyst and a data scientist?
A data analyst generally focuses on collecting, preparing, analysing and visualising information to answer business questions. A data scientist often works with more advanced statistical modelling, machine learning and predictive techniques. The roles can overlap depending on the organisation.
Can Excel alone make me a data analyst?
Excel is a useful starting tool, but many data analyst roles require additional skills such as SQL, Power BI, Python, statistical analysis and data visualisation.
Conclusion: Start Your Data Analyst Career in Malaysia
Becoming a data analyst requires a combination of technical knowledge, analytical thinking, practical experience and communication skills.
Start with Excel and SQL, develop your understanding of statistics, and learn a business intelligence platform such as Power BI or Tableau. As your skills progress, introduce Python and work on practical projects that demonstrate your ability to solve business problems.
Certifications such as Microsoft PL-300 and Tableau Desktop Specialist can support your professional development, while hands-on projects help demonstrate how you apply those skills.
For individuals planning to enter the data analytics field, choosing a structured learning pathway is an important first step.
Explore data analytics training at Nexperts Academy:
- SQL for Data Professionals
- Python for Data Analytics
- Power BI PL-300
- Tableau Desktop Specialist
- Data Science Foundation
Power BI PL-300 Training
Prepare data, model with DAX and build interactive dashboards for the Microsoft PL-300 exam.
Learn more →Python for Data Analytics
Learn Pandas, data cleaning and visualisation for practical analytics workflows.
Learn more →SQL for Data Professionals
Query, join and summarise business data from relational databases with confidence.
Learn more →